Graphing Temperatures with Tasker
To record temperature as a graph with the JNIOR, you will need 2 things. First, either the Environmental Sensor or the Rugged External Temperature Sensor. Second, you’ll need to load the Tasker update project onto your unit. This will load the Tasker and Grapher applications onto it, which we will use to create the graph.
INTEG resells an environmental sensor from Embedded Data Systems. The sensor itself won’t work directly with the JNIOR until it is wired. They have several different models that provide different environmental metrics. Temperature and humidity have been the consistent requests. INTEG also sells a rugged external sensor that tracks just temperature.
Set Up
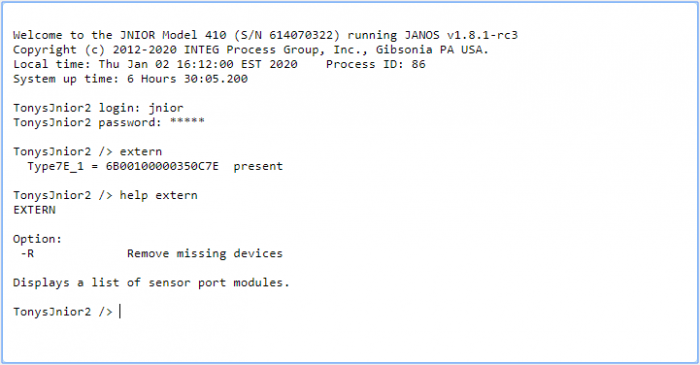
The first step in starting this setup is to check the connections on your sensor module. In the Console Tab of the JNIOR Web Tool, commands you can use to see what sensor is connected are the ‘extern’ command to tell you what modules you have connected, and the ‘extern -r’ command to remove a module on your device that is no longer connected. To tell which sensor module you have connected, look at the ID of the device from the extern command. If it ends with 7E it’s the Humidity Sensor, and if it’s 28 it’s the Rugged External Temperature sensor.
After that, you’ll want to make sure that you have the Tasker and Grapher applications loaded onto your JNIOR. This can be done using the update project below if not already installed. (Grapher gets loaded with Tasker’s update project)
| Name | Version | Release Date | Size | MD5 |
|---|---|---|---|---|
| Tasker | v13.0 | Jan 08 2026 | 3.0 MB |
Once this update project is loaded to your JNIOR, you’ll now want to open the Tasker application by typing in the URL of a web browser (JNIOR’s IP)/tasker, or by clicking the link for it from the JNIOR Web Page in the applications section of the Configuration tab (Refresh your JNIOR webpage if this isn’t appearing after the update project has been loaded to it).
In the Tasker application, the first thing we’ll want to do is create a workspace. You set its name to whatever you like. Once it’s made, you’ll open it, and then want to define the signals in the Tasker that will reference the temperatures being recorded from our temperature probe or environmental sensor. This will be done in the Signals tab.
Referring to the pictures below, you’ll need to create two signals that will reference our analog temperature values being received from. The only difference between using either module is to make sure the signal values reference the module you are using. If you have a temperature probe, set the signal value to ‘temperature probe’, and for the environmental sensor, set it to ‘environmental sensor’. For the channel field, this value represents which temperature probe or environmental sensor to use if there is more than one connected. In this example, we are only using either 1 temperature probe or 1 environmental sensor, so its value should be one. Lastly, the variable field denotes whether to use Fahrenheit or Celsius as the referenced value.


After that, we’ll create a Logger using the Logger Tab. Once on the Logger Tab of Tasker, clicking the “add Logger” button will create an empty Logger, which you can name “Log_Temps” for this example. This is where the file will be created that Grapher pulls the data from to graph.
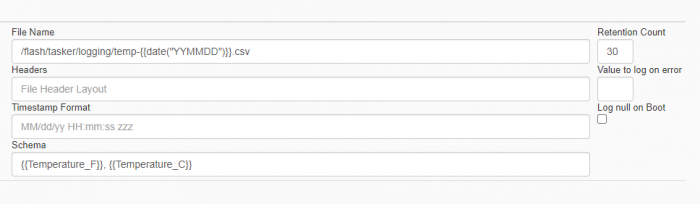
Referencing the picture below, you’ll start by setting the file path for the log that will be created. The one in this example is called temps-{{date(“YYMMDD”)}}.csv. (NOTE: The ‘{{date(“YYMMDD”)}}’ part of the file name is syntax that auto inputs the current date in its name when the file is created. More info on this and other value syntax is in the Tasker help drop-down in Tasker’s web page). Grapher specifically uses .csv files to work properly, so the files the Logger generates should always end in .csv. The Timestamp Format specifies the format of the timestamp for when the values are logged. Whenever a value is logged, a timestamp is automatically added to the log file before any other value. This is needed to know where the values in the file should be plotted on the graph that Grapher creates. Entering nothing in the Timestamp Format field will default it to MM/dd/yy HH:mm:ss zzz. For this example, we’ll use the default formatting, so leave the Timestamp Format field blank. For how the schema values work, these values reference signals from the Signal Tab in Tasker we created earlier to get Fahrenheit and Celsius from our Temperature Probe or Environmental Sensor. The double squiggly brackets let Tasker know not to interpret the signal names as just text, and to reference the signals in the Signal Tab. If the double squiggly brackets weren’t added, it would just log “Temperature_F”, and “Temperature_C” every time instead of the actual temperature values. The comma is needed in between because we are logging this file as a .csv file, which stands for “comma-separated values”. Grapher uses these commas to denote each value that will be logged in the graph, so make sure to separate the schema values in the Tasker logger with a comma.
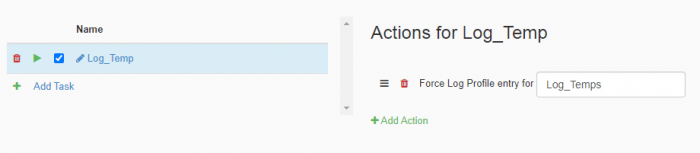
After defining the values for the Logger in Tasker, we’ll now want to create a Task in the Task Tab of Tasker. Once in the Task Tab, we’ll select the “add Task” button. This will add an empty Task to Tasker that you can name. For this example, we name the task ‘Log_Temp’. Once we do that, we’ll want to select the “add Action” button to add an action to the Task to run the Logger we just created. In the action submenu, we’ll want to select the Force Log Profile action. Once it’s added, we’ll enter the Logger name “Log_Temps” that we created earlier to the action so it’ll execute that Logger every time the Task runs.
Once that is done, we’ll now add a schedule that runs every two minutes so the graph is constantly updated with new data.
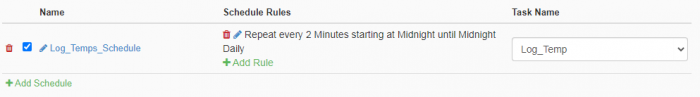
Going to the schedule Tab, we’ll click the “add Schedule” button to add an empty schedule to Tasker. We’ll then select the “Add Rule” button to open the rule submenu. Here we’ll set the Schedule to run every two minutes, every day, from Midnight to Midnight, as shown in the picture below. We’ll also set the schedule to run the “Log_Temp” Task that will execute the “Log_Temps” Logger.
Next, save this workspace by clicking the file drop-down in Tasker. Once saved, the workspace should be generating/updating the log file every two minutes. You can confirm that this is happening by going to the JNIOR webpage, and under the folder tab, go to flash -> tasker -> logging, and see if your log file is generating there.

Now that we have Tasker logging our temperature values to a file on the JNIOR, in a new tab you’ll want to navigate to the Grapher application. This can be done by either typing (JNIOR’s IP)/Grapher into the URL of a web browser, or you can select it under the tools tab of Tasker to take you to the application. Once here, you’ll want to switch to the configuration page to enter settings for creating a graph. You can access this by going to the top of the Grapher application page and at the top click Tools -> Grapher Configuration. Next, navigate to the files section and add the files that give the values to Grapher to be put on a graph.
Referencing the picture below, you’ll start by defining the directory path of the file you want monitored for the graph in the File Name field. The value entered here should typically match the name and file path from the logger in Tasker that you want to graph. (NOTE: When using the {{date(“YYMMDD”)}} syntax, Grapher doesn’t need the “” around the values inside {{date(“YYMMDD”)}} like Tasker does, so don’t include them when entering the file path for the File Name field for this example). The column value field is where you enter what you want the names of the values from the log file in Tasker to be called on the graph. When entering the names, they correspond in order of how they are entered in the schema of the Logger in Tasker. Before other values are entered for this field, a Timestamp value name needs to be added first. This is because this value is automatically generated as the first value in the file from the Logger in Tasker without needing to be defined. The Date Format will need to match how your logger in Tasker formats its date. Since the default format for a logger’s timestamp in Tasker is: MM/dd/yy HH:mm:ss zzz, this should be entered for the Date Format field here. For the file count, this is used to determine what to do when the file being logged to runs out of space. Setting this value to more than one will allow the logger to create a new file to log to, with an almost identical name as the original, and does this up to an amount of files equal to the value you set in the file count field. For this example, you can leave this as one.

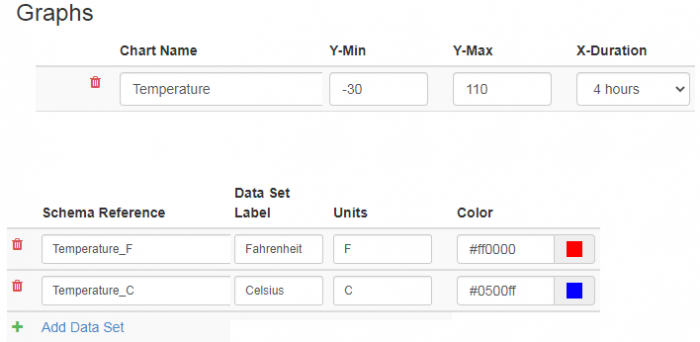
After setting the File section, you’ll now configure the Graph section as shown below. Here you can set the graph’s name, and set the data and time range being charted. Below that, you define the lines that go into the graph. You can add their names, what the units they are measured in are called, and their color. Make sure the names in the Schema Reference field match the ones from the Tasker “Log_Temps” logger. You can use the values we defined in the picture below.
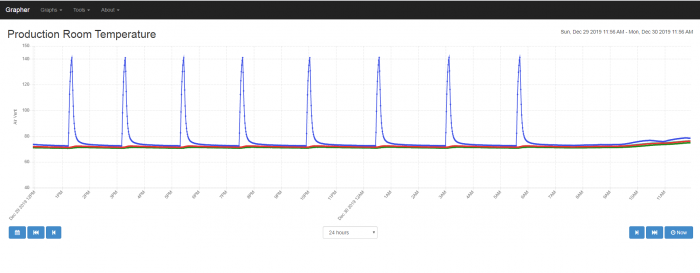
Once this is all set up, if you go to your chart in Grapher, it should now give you a graph of the logged temperatures! (If the chart doesn’t appear, try refreshing the page.)
NOTE: This procedure can be followed to graph other analog values, like signals from our 10volt and 4-20ma modules. To do so, when following along with this post and you are entering in the signals in Tasker, just change the signals to those values instead!