Graphing Temperatures with Tasker
To monitor the environment with the JNIOR you will need 3 things. First, either the Environmental Sensor or the Rugged External Temperature Sensor. Second, the Tasker application that will read that sensor and log the values. Third, the Grapher application to graph the data logged from Tasker.
INTEG resells an environmental sensor from Embedded Data Systems. The sensor itself wont work directly with the JNIOR until it is wired. They have several different models that provide different environmental metrics. Temperature and humidity have been the consistent requests. INTEG also sells a rugged external sensor that tracks just temperature.
NOTE: Only the Environmental Sensor records humidity.
Set Up
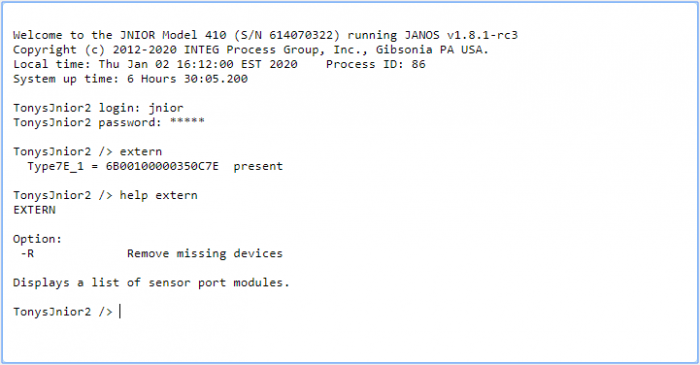
The first thing to check when setting up is the sensor module you connect to the JNIOR. In the Console Tab of the JNIOR Web Tool, commands you can use to see what sensor is connected are the extern command to tell you what modules you have connected, and the extern -r command to remove a module on your device that is no longer connected. To tell which sensor module you have connected, look at the ID of the device from the extern command. If it ends with 7E its the Humidity Sensor, if its 28 its the Rugged External Temperature sensor.

After that, you’ll want to make sure that you have the applications to graph the data logged.
| Name | Version | Release Date | Size | MD5 |
|---|---|---|---|---|
| Tasker | v12.0 | Jun 20 2023 | 2.9 MB | edfd2578eccdf8595b4f3d35f1ca4bf8 |
| Grapher | v4.1 | Jun 18 2020 | 788.5 KB | 75e992513636e0c45c7aa7f71d8c1303 |
You’ll want to do an update project one at a time, publishing these to the JNIOR you have the sensor connected to. After that, to get to the Grapher application, you can either type (JNIOR’s IP)/Grapher into the URL of a web browser or you can select it under the tools tab of Tasker to take you to the application. There you can create the graph to monitor your Temperature.
Once on the Grapher application page, you’ll want to go to the Grapher Configuration page to enter settings for creating a graph. You can access this by going to the top of the Grapher application page and at the top click Tools/Grapher Configuration. To start, you can go down to the files section and add the files that give the values to be put on a graph.

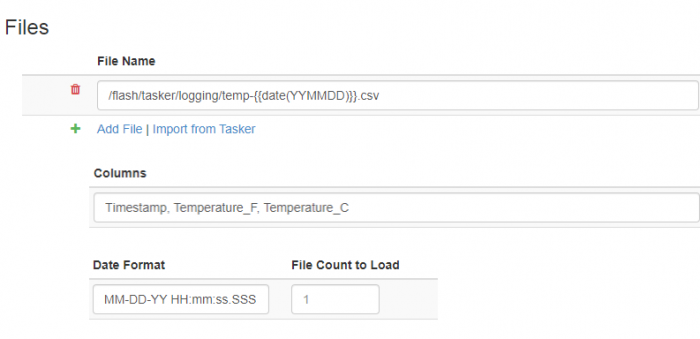
At the top, you can define the directory path of the file you want monitored, but keep in mind whatever path and file name is set here should match what you set in the Tasker application. The column value field is where you enter what you want the names of the values from the log file in Tasker to be called. One of the column values needs to be Timestamp since the graph needs that information to know where to plot it the value being pulled. The Date format can be set to MM-DD-YY HH:mm:ss.SSS. The file count is specified to how many files you want added. After setting this, you can configure the Graph section described below that will be monitored for the graph.

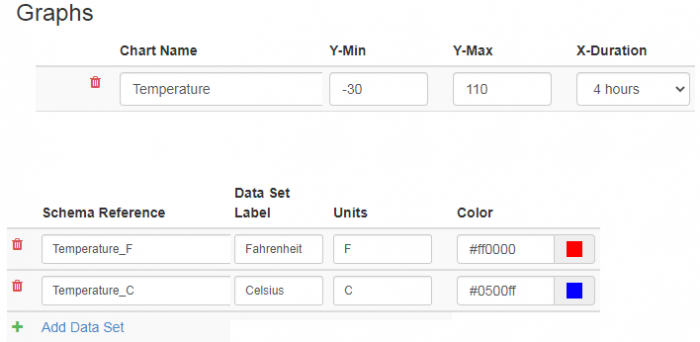
Here you can create the graph name, and then set the range of the graph and also the time range being charted. Below that you can create the lines that go into the graph that are tracked. You can add their names, what the units they are measured in are called, and the color of the line. Once this is all set you’ll now want to open the Tasker application by typing in the URL (JNIOR’s IP)/tasker, or by clicking the link for it from the JNIOR Web Page in the applications section of the Configuration tab.
In the Tasker application, the first thing we’ll want to do is create a workspace. After that we’ll create a Logger using the Logger Tab. Once on the Logger Tab of Tasker, clicking the “add Logger” button will create an empty Logger in the Logger Tab, which you can name Log_Temp for this example. This is where the file will be created that Grapher pulls the data from to graph.

Like in the picture above, you’ll want to set the log file path. The one in the example is called temps-{{date(YYMMDD)}}.csv just like the one named in the file section in Grapher of this example, the only difference being that the YYMMDD has “” around it while the file section in Grapher should not. (The date.format part of the file name auto inputs the date when creating the file). The Timestamp Format specifies the Timestamp of when the value are logged. This is needed to know where the files need to be plotted in Grapher, which is also why we included the Timestamp value in Grapher eariler. Entering nothing in the Timestamp Format field will default it to MM/dd/yy HH:mm:ss zzz, so you don’t need to enter anything in this field unless you want to change formatting of the default timestamp. The Schema field will contain separate values that act as the referenced schema values we defined in the graph section of Grapher.
For how the schema values work, they simply refer to values on the JNIOR such as the I/O or analog values. The double squiggly brackets and comma between each value are needed to separate each value. The picture above uses Signals from the signal tab, so you’ll need to go to the Signal tab after this and create two signals for Celsius and Fahrenheit for the humidity temperature sensor. Make sure the names in brackets in the schema under logger and the signal names in the signal tab match each other. More information on how to reference values on the JNIOR in a Logger, go to the help drop down at the top of the Tasker page and select the help link.
After defining the values for the Logger in Tasker, we’ll now want to create a Task in the Task Tab of Tasker. Once in the Task Tab, we’ll select the “add Task” button. This will add an empty Task to Tasker that you can name. Once we do that, we’ll want to select the “add Action” button to add an action to the Task to run the Logger we just created. In the action submenu we’ll want to select the Force Log Profile action. Once its added, we’ll enter the Logger name we created earlier to the action so it’ll run that Logger every time the Task runs.

Once that is done, we’ll now add a schedule that runs every two minutes so the graph is constantly getting more data every two minutes.
Going to the schedule Tab, we’ll click the “add Schedule” button to add an empty schedule to Tasker. We’ll then select the “add Rule” button to open the rule submenu. Here we’ll set the Schedule to run every two minutes, every day, from Midnight to Midnight like shown in the picture below. We’ll also set the schedule to run the Task that activates Logger to every two minutes.

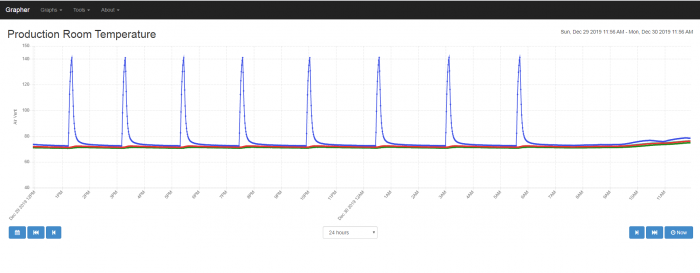
Once this is all set up, going back to the Grapher application should now give you a graph of the logged temperatures!
